
Forms & Records
Home › Product › Microscope
Microscope
See how a pilot is really doing.
Every approved check feeds the Microscope. One trainee, one fleet or one instructor: the same questions, answered from the records themselves rather than from memory.
One trainee
Decision support, not a spreadsheet
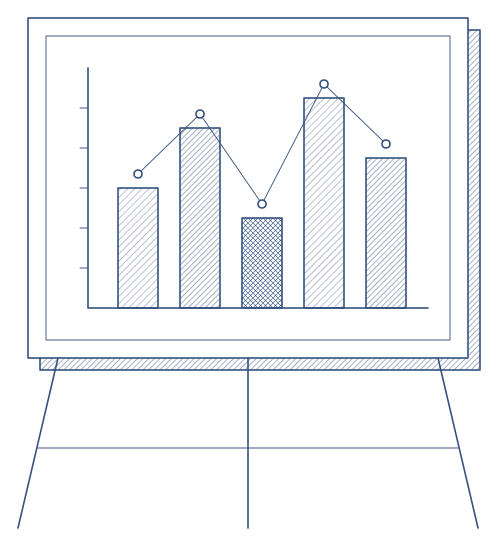
The numbers that matter, filtered your way
Pass rate, trend, average grade and a competency profile across the domains your framework uses. Narrow it to a form, a period, a training context or an instructor, and every figure follows. A risk marker flags the trainees who need a conversation.
- Competency-based and task-based results kept apart
- Compared with peers in the same role
- What changed since you last looked
Threats, errors and what caught them
The threats and errors instructors recorded during the flight or session, grouped by type and by the competency that managed them, or did not. Alongside: which safety topics this trainee has actually been assessed on, and what instructors said about the sessions.
- Managed, mismanaged or undetected, per event
- Coverage of your training topics
- Notes and actions kept with the trainee
A trainee file you can hand over
One click produces the file for a review meeting or a fleet manager: headline numbers, strengths and weaknesses, recommendations, recent checks, upcoming sessions and notes. Every time someone opens a trainee's page, that is on the record too.
- A watch list for the trainees you are following
- Plain-language summary and suggested actions
- Who looked at whose data, and when
One fleet
From individual results to a syllabus change
The same analysis for the whole fleet: which competencies are slipping, which threats keep recurring, where a refresher is indicated and why.
- Competency profile with the last month against the one before
- Threats and errors fleet-wide
- Recommendations for the syllabus, with the evidence behind them
- Instructor pass rates compared, with names hidden unless you are allowed to see them
One instructor
Standardisation you can measure

Instructor pages
The same questions pointed at an instructor: how many checks, what pass rate and average grade they give, whether that is drifting, and which competencies they score lowest. Compared with peers, it shows generosity, not quality, and says so. Trainee feedback on sessions is pooled here, anonymously.
Calibration you can measure
Several instructors grade the same evidence without seeing each other's marks. The report shows how closely they agree, competency by competency, against a standard your department sets. Each instructor's standing appears on their page: meets the standard, below it, or not enough data yet.
- Rate on the iPad or on the web
- Names hidden unless you are allowed to see them
- Recurrent standardisation prompted when needed
Goes with
Compliance
What the authority seesMatrix, dossiers and exports.
ComplianceUse case